How Boiler Room’s sound evolved
An analysis of fifteen years of styles, from techno and deep house to drum and bass and hard techno, and of what its most watched sets changed
What this is, and what it is not
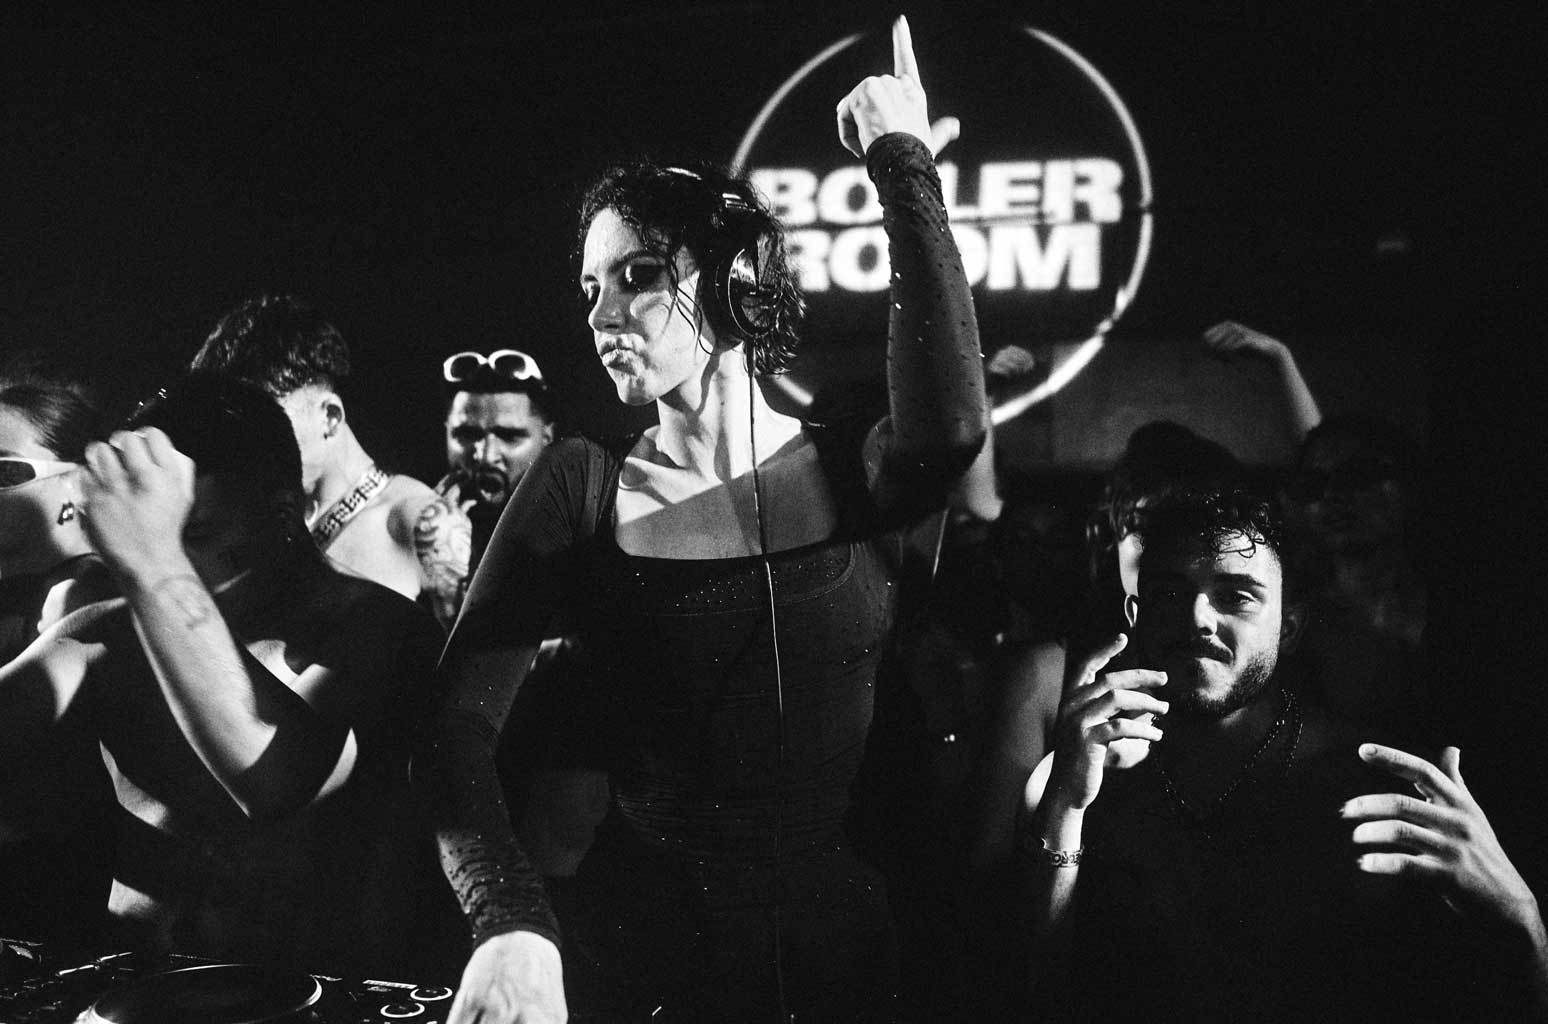
Boiler Room began in London in 2010 as a filmed DJ set: one camera, the DJ, the people standing behind them. Its YouTube channel now holds 10,239 videos. This study asks a narrow question of them: what music has been played in these sets, and how has that changed? It says nothing about why. A change in the programme and a change in which sets happen to have been identified can look exactly alike, and where the data cannot tell them apart, we say so.
The limits come first, because they shape every result that follows.
Not every set is in the data. The tracklists come from automatic audio identification (see how this was made, at the end). For the years 2023 to 2025 about nine in ten of the channel’s long videos (40 to 150 minutes) have a tracklist. For 2020 to 2022 it is between a third and three fifths. Before 2020 it is one in ten to one in five (Figure 8). We therefore treat 2022 to 2026 as the reliable core, 1,358 sets, and the years before as a flagged past, 887 sets, shown in every figure but dimmed. 2026 runs to mid-October.
The sets we hold from the past are the well-known ones. In 2012 to 2019, the median set in our data sits between the 69th and the 82nd percentile of its year’s views; from 2022 it sits at the 50th, as a complete sample should. We test below whether this alone could explain what we find. In one important case it cannot.
Only part of a set is identified. The median set carries ten identified songs, for an hour of music. Unreleased tracks, edits and records the fingerprinting does not know stay blank.
Styles and release years come from Discogs, matched song by song, and the match weakens for recent music. Four in five plays had a release year in 2016 to 2018; one in two does in 2025 and 2026. The unmatched are, very likely, recent or unreleased records. Every figure about the age of the music is therefore read “among the plays with a release year”, and we give the range it could take if the others were counted.
The unit is the set. Some sets appear twice in the source, once from YouTube and once from SoundCloud; they are merged into one, with the union of their songs. A song counts once per set. A set’s year is the year its title names, where it names one (fifteen festival sets were filmed one year and uploaded the next), and otherwise the year of upload.
Uncertainty. The bands and ranges in the figures are 95% intervals obtained by resampling whole sets within each year: songs in the same set are not independent of one another. A period’s value is the average of its years, each year counted once, so that the well-covered years do not outweigh the rest.
1. Omnivorousness: is the sound widening?
The numbers behind this figure
| Year | Sets | Effective number of styles (95% interval) | Difference between two songs of a set |
|---|---|---|---|
| 2012 (few sets) | 31 | 9.9 (7.7 to 13.3) | 0.73 (0.67 to 0.78) |
| 2013 | 61 | 10.8 (8.7 to 13.6) | 0.74 (0.69 to 0.78) |
| 2014 | 81 | 11.9 (9.4 to 14.9) | 0.69 (0.64 to 0.74) |
| 2015 | 88 | 9.7 (7.9 to 12.5) | 0.70 (0.65 to 0.74) |
| 2016 | 79 | 12.0 (9.3 to 16.1) | 0.75 (0.70 to 0.79) |
| 2017 | 79 | 15.1 (10.9 to 21.5) | 0.75 (0.71 to 0.79) |
| 2018 | 88 | 8.0 (6.2 to 10.6) | 0.71 (0.67 to 0.75) |
| 2019 | 151 | 10.7 (8.6 to 13.8) | 0.74 (0.71 to 0.77) |
| 2020 | 124 | 17.6 (13.7 to 22.8) | 0.80 (0.77 to 0.83) |
| 2021 | 105 | 15.1 (11.5 to 20.3) | 0.79 (0.75 to 0.83) |
| 2022 | 243 | 20.0 (16.8 to 24.3) | 0.79 (0.76 to 0.81) |
| 2023 | 420 | 22.3 (19.4 to 25.3) | 0.79 (0.77 to 0.81) |
| 2024 | 324 | 18.5 (15.4 to 22.3) | 0.76 (0.73 to 0.79) |
| 2025 | 273 | 19.5 (15.8 to 23.9) | 0.76 (0.72 to 0.80) |
| 2026 | 98 | 19.3 (13.4 to 28.6) | 0.67 (0.60 to 0.74) |
| Mean of 2012-2015 | 10.8 (9.6 to 12.4) | 0.71 (0.68 to 0.74) | |
| Mean of 2016-2021 | 13.1 (11.8 to 15.1) | 0.76 (0.74 to 0.77) | |
| Mean of 2022-2026 | 19.9 (18.2 to 22.3) | 0.76 (0.74 to 0.77) |
Effective number of styles: the number of equally common styles that would make two songs from two different sets as likely to share a style as they are. Difference: 0 when two songs of a set have the same styles, 1 when they have none in common.
The sociology of taste has a well-known thesis for the late twentieth century: that the cultivated listener stopped being a snob, who holds to one noble genre, and became an omnivore, who takes something from many (Peterson and Kern, 1996). A booking platform is not a listener, but the question carries over. Over fifteen years, has Boiler Room come to draw on more styles?
There are two ways to ask it, and they give different answers.
Across all the sets of a year, yes. We measure the range of a year’s music by its effective number of styles: the number of equally common styles that would make two songs drawn from two different sets as likely to share a style as they actually are. It does not grow simply because a year has more sets, which matters here, since the well-covered years have four times as many. It rose from about 11 in 2012 to 2015 and 13 in 2016 to 2021 to about 20 in the core (Figure 1, left; interval 18 to 22). A cruder count says the same: on sixty sets drawn at random from each year, the styles needed to account for 80% of plays numbered 16 to 26 before 2020 and 32 to 37 after.
At the coarser level of Discogs’ genres, the movement is smaller but in the same direction. Electronic music made up 79% of plays in 2016 to 2021 and 72% in the core. Hip hop rose from 7% to 11%; pop from 2% to 5%; Latin from 2% to 3%.
Inside a single set, no. For each set we take every pair of its identified songs and ask how different their styles are, from 0 (the same styles) to 1 (none in common), then average. A typical set scores 0.76 in 2016 to 2021 and 0.76 in the core (Figure 1, right). The earliest years are slightly lower, about 0.71. Within the core the score drifts down, but most of that drift is 2026, a partial year.
The two results together describe a particular kind of widening. Boiler Room’s programme came to hold more kinds of night; each night did not become more varied. The omnivore, if there is one here, is the platform’s schedule, not the DJ in front of the camera.
Can the sample explain it? The rise coincides exactly with the break in coverage between 2019 and 2020, and within the reliable core the range is flat (no trend; interval from minus 1.9 to plus 1.6 styles a year). The worry is that the past looks narrow only because the sets we have from it are the famous ones. We can test that inside the core, where coverage is nearly complete: there, the most-viewed fifth of sets has an effective number of 20, the middle three fifths 18, the least-viewed fifth 27. A sample made only of famous sets would look no narrower than the whole. Selection by popularity does not produce the gap. Selection of another kind (which sets got identified at all, and whether that favoured some styles) cannot be ruled out with these data.
Verdict: partly supported. The programme widened, by about half, between the past and the core. Single sets did not. The timing of the widening cannot be separated from the timing of the coverage.
2. Presentism or retromania: how old is the music?
The numbers behind this figure
| Year | Sets | Records before 1990, share of all plays | Released in the last two years, among dated plays | Possible range, counting the undated | Plays with a release year |
|---|---|---|---|---|---|
| 2012 (few sets) | 31 | 9.3% (3.9 to 16.7) | 66% (57 to 78) | 50% to 75% | 75% |
| 2013 | 61 | 11.2% (7.3 to 15.4) | 64% (55 to 72) | 52% to 71% | 81% |
| 2014 | 81 | 13.9% (8.6 to 19.1) | 52% (45 to 59) | 40% to 63% | 77% |
| 2015 | 88 | 8.5% (5.3 to 11.9) | 59% (51 to 67) | 47% to 67% | 80% |
| 2016 | 79 | 6.6% (4.0 to 10.0) | 61% (52 to 69) | 49% to 69% | 80% |
| 2017 | 79 | 12.6% (7.9 to 17.8) | 47% (39 to 56) | 38% to 58% | 80% |
| 2018 | 88 | 7.4% (4.5 to 10.7) | 57% (50 to 63) | 45% to 65% | 80% |
| 2019 | 151 | 3.8% (2.4 to 5.3) | 61% (55 to 66) | 49% to 69% | 80% |
| 2020 | 124 | 4.2% (2.1 to 7.1) | 61% (55 to 67) | 44% to 72% | 72% |
| 2021 | 105 | 2.8% (1.5 to 4.4) | 58% (53 to 64) | 40% to 71% | 69% |
| 2022 | 243 | 1.9% (1.1 to 3.0) | 50% (46 to 53) | 32% to 68% | 64% |
| 2023 | 420 | 1.2% (0.8 to 1.7) | 49% (46 to 52) | 29% to 70% | 59% |
| 2024 | 324 | 1.3% (0.6 to 2.4) | 49% (45 to 53) | 27% to 72% | 56% |
| 2025 | 273 | 1.4% (0.8 to 2.2) | 51% (46 to 55) | 25% to 76% | 49% |
| 2026 | 98 | 0.4% (0.1 to 0.9) | 46% (39 to 54) | 23% to 74% | 49% |
A decade and a half ago, a critic argued that popular culture had become addicted to its own past: revivals, reissues, archives, the recent decades recycled faster than they could recede (Reynolds, 2011). Dance music is often held up as the counter-example, a culture of the new record and the white label. The tracklists allow a direct reading: at the moment of the set, how old is what is played?
The answer depends on the match rate more than on anything else, and that has to be said first.
Among the plays with a release year, about half are less than three years old. In the flagged past, 58% of dated plays were released in the year of the set or the two years before; in the core, 49%. The median gap between release and set moves from about one year to about three. Read naively, the music has aged.
But the share of plays with a release year fell from 77% to 56% over the same span, and the plays without one are, very likely, the newest: records not yet catalogued, edits, unreleased music. If none of them were recent, the share of recent music in the core would be 27%; if all were, 72% (Figure 2, right). The past’s range is 44% to 67%. The two ranges overlap almost entirely. On the question of how much new music is played, the data cannot decide. For the same reason, the share of songs played before their official release, about 7% of dated plays in the past, appears to fall to zero in 2025 and 2026; this is an artefact, since those records are not yet in the catalogue.
What the data can decide is the oldest music. Records from before 1990 are almost always catalogued, so their share of all plays, dated or not, hardly depends on the match rate. It was 11% in 2012 to 2015, 6% in 2016 to 2021, and is 1.3% in the core (Figure 2, left; interval 0.9% to 1.6%). The fall is steady, year on year, and continues inside the core. Among dated plays, the 1970s and 1980s together went from between 8% and 18% of plays before 2018 to about 2% from 2022. The 1990s and 2000s kept roughly their place, at about a tenth each.
Verdict: supported for the far past, undecided for the present. The deep past (disco, early house and electro, the records of the 1970s and 1980s) has all but left the Boiler Room set. Whether the newest music has gained ground, the identification of recent records is too incomplete to say. Retromania, at Boiler Room, does not reach back further than about thirty years.
3. Genre waves: what rose and what fell?
The numbers behind this figure
| Style | 2016-2021 | 2022-2026 | Change | 95% interval of the change |
|---|---|---|---|---|
| Drum n Bass | 1.1% | 4.3% | +3.3 points | +2.0 to +4.7 |
| Trap | 1.0% | 2.5% | +1.5 points | +0.7 to +2.1 |
| African | 0.6% | 2.0% | +1.4 points | +0.6 to +2.3 |
| Trance | 1.2% | 2.5% | +1.3 points | +0.9 to +1.7 |
| UK Garage | 0.8% | 2.0% | +1.2 points | +0.7 to +1.7 |
| Reggaeton | 0.5% | 1.6% | +1.1 points | +0.4 to +1.8 |
| Dance-pop | 0.5% | 1.6% | +1.1 points | +0.8 to +1.4 |
| Bass Music | 0.8% | 1.7% | +0.9 points | +0.6 to +1.3 |
| Dubstep | 1.0% | 1.9% | +0.9 points | +0.4 to +1.5 |
| Contemporary R&B | 0.9% | 1.8% | +0.9 points | +0.4 to +1.4 |
| Techno | 22.8% | 16.5% | -6.4 points | -9.1 to -3.4 |
| Deep House | 4.9% | 1.7% | -3.3 points | -4.1 to -2.5 |
| Electro | 5.9% | 3.3% | -2.5 points | -3.6 to -1.4 |
| Disco | 2.8% | 0.7% | -2.1 points | -2.8 to -1.5 |
| Acid | 2.0% | 0.8% | -1.2 points | -1.6 to -0.9 |
| Experimental | 2.7% | 1.5% | -1.1 points | -1.7 to -0.6 |
| House | 12.4% | 11.5% | -1.0 points | -2.5 to +0.5 |
| Industrial | 1.3% | 0.4% | -0.9 points | -1.2 to -0.6 |
| Funk | 1.1% | 0.2% | -0.9 points | -1.2 to -0.6 |
| Ambient | 1.4% | 0.6% | -0.8 points | -1.1 to -0.5 |
Styles that passed half a percent of plays in 2022-2026 from below it: Dance-pop, Hard Techno, Hard House, Electro House, Euro House, Hardstyle, Cloud Rap, Hard Trance. Styles that fell below it: Garage House, Abstract, Leftfield, Minimal, Nu-Disco, IDM, Downtempo, Acid House, MPB, EBM, Soul, Funk, Industrial. Each period is the mean of its years.
The previous sections measured range and age. This one names the styles, as Discogs classifies them, whose share changed between the flagged past and the core by more than the uncertainty allows (Figure 3). The comparison is between period averages; all changes cited are clear of zero at the 95% level unless stated.
What rose. Drum and bass, from 1.1% of plays to 4.3%, is the largest gain. Behind it, each roughly doubling or tripling from a small base: trap (1.0% to 2.5%), styles Discogs files as African (0.6% to 2.0%), trance (1.2% to 2.5%), UK garage (0.8% to 2.0%), reggaeton (0.5% to 1.6%), dance-pop (0.5% to 1.6%), bass music, dubstep and contemporary R&B. A group of styles that barely existed in the past sample now passes half a percent of plays: hard techno, hard house, hardstyle, hard trance, Euro house, electro house and cloud rap.
What fell. Techno remains the single largest style but lost a quarter of its share, from 22.8% to 16.5%. Deep house fell from 4.9% to 1.7%, electro from 5.9% to 3.3%, disco from 2.8% to 0.7%, acid from 2.0% to 0.8%; experimental, industrial, ambient and funk also declined. Several styles dropped below half a percent: minimal, IDM, downtempo, leftfield, nu-disco, acid house, EBM, soul.
What held. House is the instructive exception. Its share halved in the flagged past, from 20% in 2012 to 2015 to 10% by 2020, and has held at 10% to 12% since. The change between the two periods is therefore not significant, but the house of the core is not the house of the early years.
The two lists read as one movement. The styles that lost ground are those of the club as it was understood around 2012 to 2018: deep, minimal, acid, electro, disco, the long-form and the reference. The styles that gained are faster, harder, or from outside electronic music altogether: drum and bass, the hard styles, trance, and the genres of rap, Latin pop and African dance music. The same caution as in section 1 applies: the sharpest of these changes happen at the break in coverage, and the past is a sample of famous sets.
Verdict: supported, as description. The style mix of the core differs clearly from that of the past, in a consistent direction.
4. Where it is booked
The numbers behind this figure
| Year | Videos of 20 minutes or more | Naming a place | Outside Europe and North America (95% interval) | Europe | North America |
|---|---|---|---|---|---|
| 2012 | 415 | 186 | 0% (0 to 0) | 65% | 35% |
| 2013 | 673 | 331 | 0% (0 to 0) | 54% | 46% |
| 2014 | 774 | 564 | 9% (7 to 12) | 71% | 20% |
| 2015 | 780 | 530 | 6% (4 to 8) | 72% | 22% |
| 2016 | 932 | 632 | 10% (8 to 13) | 64% | 25% |
| 2017 | 752 | 564 | 19% (16 to 22) | 55% | 26% |
| 2018 | 455 | 197 | 37% (31 to 44) | 46% | 17% |
| 2019 | 999 | 401 | 26% (22 to 30) | 50% | 24% |
| 2020 | 335 | 60 | 55% (42 to 68) | 37% | 8% |
| 2021 | 380 | 205 | 2% (0 to 4) | 81% | 17% |
| 2022 | 434 | 265 | 38% (33 to 44) | 51% | 11% |
| 2023 | 495 | 360 | 27% (23 to 32) | 46% | 27% |
| 2024 | 362 | 296 | 27% (23 to 33) | 48% | 25% |
| 2025 | 311 | 240 | 46% (40 to 52) | 32% | 22% |
| 2026 | 126 | 104 | 40% (32 to 50) | 54% | 6% |
The idea of a globalised circuit is easy to state and hard to measure. Here we can measure one thing: the place a video’s title names after “Boiler Room”, against a hand-checked list of cities. This test needs no tracklist, so it uses every video of twenty minutes or more on the channel, 8,223 in all, and the coverage problem of the other sections does not arise.
The circuit widened. Among videos that name a place, the share filmed outside Europe and North America was 4% in 2012 to 2015, 25% in 2016 to 2021, and 36% in the core (Figure 4). Europe’s share fell from 65% to 56% to 46%, North America’s from 31% to 20% to 18%. Asia went from 1% to 13% to 15%, Africa from 0.3% to 4% to 9%, South America from 1% to 7% to 8%. The effective number of cities, measured as for styles, rose from 6 to 14 to 23.
Two years break the pattern, and both are explained by the channel itself. In 2020 only 18% of titles name a place at all: these were the streams of the lockdown, filmed wherever the DJ was. In 2021, as rooms reopened, nearly every named place is in Europe. Within the core, the share outside Europe and North America still rises slightly; the number of cities does not.
The tracklisted sets show the same picture (21% of named places outside Europe and North America in the past, 35% in the core), which suggests that the sets in our data are, at least geographically, not unrepresentative of the channel.
Verdict: supported. The map widened, mainly between 2014 and 2019, and in the core a third of named places lie outside Europe and North America. One caveat: only places on the list count, and a city missing from it would be counted as no place.
5. What does not change: the hour
The numbers behind this figure
| Year | Channel videos of 20 minutes or more | Running 55 to 65 minutes (95% interval) | Median minutes | Sets with a tracklist: 55 to 65 minutes | Sets with a tracklist: over 90 minutes |
|---|---|---|---|---|---|
| 2012 | 415 | 14% (10 to 17) | 46 | 16% | 6% |
| 2013 | 673 | 19% (15 to 22) | 46 | 25% | 13% |
| 2014 | 774 | 29% (26 to 32) | 53 | 42% | 17% |
| 2015 | 780 | 34% (30 to 37) | 55 | 48% | 15% |
| 2016 | 932 | 31% (28 to 34) | 55 | 46% | 20% |
| 2017 | 752 | 38% (35 to 41) | 56 | 49% | 13% |
| 2018 | 455 | 41% (37 to 46) | 57 | 68% | 5% |
| 2019 | 999 | 48% (45 to 51) | 58 | 67% | 5% |
| 2020 | 335 | 37% (32 to 42) | 55 | 51% | 6% |
| 2021 | 380 | 37% (32 to 42) | 58 | 68% | 5% |
| 2022 | 434 | 58% (53 to 62) | 59 | 66% | 5% |
| 2023 | 495 | 61% (57 to 65) | 59 | 67% | 2% |
| 2024 | 362 | 63% (58 to 69) | 59 | 65% | 3% |
| 2025 | 311 | 58% (53 to 63) | 59 | 62% | 3% |
| 2026 | 126 | 61% (52 to 69) | 58 | 63% | 1% |
We began with the assumption that one thing, at least, was fixed: the Boiler Room set lasts an hour. In the core this is true. Six in ten of the channel’s videos of twenty minutes or more run between 55 and 65 minutes, and the median is 59 minutes.
It was not always true. In 2012 to 2015 only 24% of such videos ran 55 to 65 minutes, and the median was 50. In 2016 to 2021 the share was 39%. The step to 60% comes in 2022 and has held since (Figure 5). Among the tracklisted sets, which are all music, the same movement appears: 38% of sets ran 55 to 65 minutes in 2012 to 2015, 58% in 2016 to 2021, and 65% in the core. Sets of more than ninety minutes went from 15% to 9% to 3%.
The channel’s longer videos include material other than sets, and in the early years part of what it published was shorter or cut differently. Those differences could explain some of the low early figures for the whole channel. They cannot explain the same rise among the tracklisted sets, which are sets by construction.
Verdict: not supported as stated. The hour is not the constant against which the rest moved. It is itself one of the things that moved: a format that hardened over a decade, and became near-universal at about the moment the programme widened. The more kinds of music the platform took in, the more uniform the frame it put them in.
6. After the landmark sets: did the most watched sets change what came next?
The numbers behind this figure
| Set | Views | Songs identified | Its three main styles | Their share of plays, year before to year after | Change, points | Percentile among other dates | Other sets playing one of its songs | Percentile among ordinary sets |
|---|---|---|---|---|---|---|---|---|
| 2013 Nightmares On Wax | 12,938,401 | 19 | Soul, Disco, House | 32.1% to 26.6% | -5.5 | 13th | 0% to 0% | 20th of 20 |
| 2013 Kaytranada | 25,282,161 | 17 | House, Contemporary R&B, New Jack Swing | 21.2% to 21.0% | -0.2 | 56th | 0% to 1% | 87th of 30 |
| 2014 Maceo Plex | 16,928,748 | 14 | Techno, House, Tech House | 39.6% to 50.9% | +11.3 | 100th | 1% to 0% | 11th of 27 |
| 2015 Solomun | 77,141,759 | 14 | House, Deep House, Tech House | 31.3% to 32.0% | +0.7 | 98th | 3% to 0% | 0th of 21 |
| 2018 Honey Dijon | 12,468,745 | 11 | House, Deep House, Tech House | 23.8% to 19.8% | -4.0 | 45th | 0% to 0% | 35th of 37 |
| 2018 Sama' Abdulhadi | 15,378,643 | 16 | Techno, Tech House, Downtempo | 30.3% to 31.6% | +1.3 | 63th | 0% to 0% | 24th of 41 |
| 2019 Folamour | 7,851,446 | 15 | Disco, Nu-Disco, Jazz-Funk | 2.4% to 2.1% | -0.3 | 40th | 0% to 0% | 21th of 71 |
| 2022 Fred again.. | 56,267,447 | 18 | House, Minimal, Deep House | 13.8% to 15.6% | +1.8 | 97th | 0% to 2% | 100th of 137 |
| 2023 Sara Landry | 11,910,157 | 17 | Techno, Hard Techno, House | 26.9% to 30.9% | +4.0 | 100th | 0% to 0% | 75th of 207 |
| 2023 Chase & Status | 15,015,909 | 20 | Drum n Bass, Jungle, Dubstep | 7.8% to 5.9% | -1.9 | 6th | 1% to 0% | 17th of 222 |
| 2025 ¥ØU$UK€ ¥UK1MAT$U | 21,133,429 | 16 | Techno, House, Contemporary | 29.7% to 31.2% | +1.5 | 78th | 1% to 1% | 72th of 157 |
4 of 11 sets are above the 90th percentile for the sound, against 1.1 expected by chance; 1 for the songs. The year after starts 45 days after the upload.
A few Boiler Room sets are watched far more than the rest: tens of millions of views, where a typical long video on the channel has between twenty and eighty thousand. It is often said that sets like these change the scene. The data can test one narrow version of that claim: after such a set was published, did Boiler Room’s later sets sound more like it, or play its songs?
We took the ten most watched sets we hold a tracklist for (with at least ten identified songs and a full year of sets on either side), and one more that the author asked about, Folamour’s set of 2019. Each is dated by its upload, when its audience saw it. A Boiler Room set is published about six weeks after it is filmed, so only the sets uploaded from six weeks after a landmark can have been filmed after it: the year after starts there. The year before is the year before the upload. Two measures, each read against a comparison:
- Its sound. The share of plays, across all of Boiler Room’s sets, in the landmark’s own three main styles, the year after against the year before. The same change is measured around 31 to 62 other dates, every month from six months to three years away, so that a style already rising does not look like the landmark’s doing. A change larger than nine in ten of those is marked.
- Its songs. The share of other performers’ sets that play at least one of the landmark’s identified songs, after against before, compared with the same measure for the ordinary sets published within six months of it.
The songs did not travel. In the year after every one of the eleven, between 0% and 2% of other performers’ sets played even one of its songs, much as before. Only Fred again..’s London set of 2022 stands out from the ordinary sets of its months, and only from 0% to 2%. However many people watch a set, the people booked after it do not replay it.
The sound moved after four of them (Figure 6), where chance would give about one:
- Maceo Plex, Berlin, 2014: techno, house and tech house went from 39.6% to 50.9% of plays, the largest change in the group.
- Solomun, Tulum, 2015, the channel’s most watched set: house, deep house and tech house held (31.3% to 32.0%) at a time when, at other dates, they were falling.
- Fred again.., London, 2022: house, minimal and deep house rose from 13.8% to 15.6%. The result is fragile: counted from the upload itself the rise is +1.1 points, and from three months after it +0.3.
- Sara Landry, Teletech Festival, 2023: techno, hard techno and house rose from 26.9% to 30.9%, the clearest case. It holds whether the year after starts at the upload, six weeks later or three months later (+3.7 to +4.4 points).
The other seven moved no more than at ordinary dates, and two went the other way. Chase & Status’s London set of 2023 was followed by a fall in drum and bass, jungle and dubstep (7.8% to 5.9%), although drum and bass is the style that grew most over the core as a whole (section 3). Folamour’s disco, nu-disco and jazz-funk stayed where they were, at about 2%.
Verdict: mostly not, with one clear exception. A landmark set does not, on this evidence, reshape what Boiler Room plays the following year, and its songs are not taken up. Four of eleven were followed by a rise in their own styles larger than at ordinary dates, more than chance would give, and the clearest of them, Sara Landry’s set of 2023, stands at the start of the hard techno wave seen in section 3. Whether that set led the wave or rode it, the data cannot say: the most watched sets are also the ones most in step with what audiences already wanted.
Folamour and the older pop hit
The numbers behind this figure
| Year | Sets | Sets with an older pop hit (95% interval) |
|---|---|---|
| 2012 (few sets) | 31 | 6% (0 to 16) |
| 2013 | 61 | 11% (3 to 20) |
| 2014 | 81 | 14% (6 to 21) |
| 2015 | 88 | 7% (2 to 12) |
| 2016 | 79 | 10% (4 to 18) |
| 2017 | 79 | 11% (5 to 19) |
| 2018 | 88 | 8% (2 to 14) |
| 2019 | 151 | 7% (3 to 12) |
| 2020 | 124 | 6% (2 to 10) |
| 2021 | 105 | 6% (2 to 10) |
| 2022 | 243 | 12% (8 to 16) |
| 2023 | 420 | 12% (9 to 15) |
| 2024 | 324 | 14% (10 to 18) |
| 2025 | 273 | 16% (12 to 21) |
| 2026 | 98 | 10% (4 to 16) |
| Period | Older pop hits played | First third | Middle third | Last third |
|---|---|---|---|---|
| 2016-2021 | 64 | 27% | 30% | 44% |
| 2022-2026 | 262 | 29% | 37% | 34% |
Around Folamour's set of June 2019 (the year after starts 45 days after its upload):
| Window | Before | After | Change | Percentile among other dates |
|---|---|---|---|---|
| 1 year each side | 6.5% | 6.4% | -0.1 points | 40th of 62 |
| 2 year each side | 9.0% | 6.9% | -2.1 points | 23th of 62 |
An older pop hit: filed under Pop by Discogs, released 10 years or more before the set, and played by 10 stations or more in the whole collection.
Folamour’s Boiler Room sets are remembered for a move rather than a style: a well-known pop record from decades earlier, dropped into a set of disco and house. His set at Sugar Mountain in 2024 plays a 1990 pop hit at minute 47 of 60; his FLY Open Air set of June 2019, the most watched of his, ends on another 1990 single. Did that move spread after the 2019 set?
For every set we asked whether it plays an older pop hit: a record Discogs files under Pop, released at least ten years before the set, and played by at least ten stations in the whole collection.
It did not spread after June 2019. In the year before that set, 6.5% of Boiler Room sets played an older pop hit; in the year after, 6.4%. Two years either side, 9.0% before and 6.9% after. Both changes are ordinary next to the same change measured around other dates.
It did spread later. From 2022, 12% to 16% of sets a year play one, against 6% to 11% before (Figure 7). Its place in the set changed with it: in 2016-2021, 44% of these records came in the last third of the set, the place of a closer; from 2022, 34%, and the middle third holds the most, 37%. The pop record moved from the end of the set towards its middle.
Two cautions. The step of 2022 coincides with the break in coverage, as in section 1. And the measure misses some records: the single that ends Folamour’s 2019 set was matched to a 2019 remaster, so Discogs gives it the year of the reissue and it does not count as older here.
Verdict: not after Folamour. The older pop hit became a more common Boiler Room move, and moved towards the middle of the set, but from 2022, three years after his set, not in the year that followed it.
What moves, and what holds
Taken together, the five tests describe a platform that diversified at the level of its programme and standardised at the level of its format. Between the years before 2020 and the years after, Boiler Room drew on about half as many styles again, booked a third of its named places outside Europe and North America, and took in rap, Latin, African and harder dance music at the expense of the deep, minimal and disco-derived styles of its early years. Over the same span, the single set did not become more varied, the music older than 1990 nearly disappeared, and the hour became the norm. Its most watched sets, finally, were rarely followed by a change in what it played, and their songs were almost never taken up by the performers who came after.
A plausible reading, which these data can describe but not establish, is that the platform became a portfolio: many specialist rooms, each as focused as before, side by side in the same format. Whether that is a choice of programming, a change in who is filmed, or a change in which sets were identified, the numbers alone cannot settle, and the strongest results here (the vanishing of the far past, the widening map, the hardening hour) are also the ones least exposed to that doubt.
How this was made
The numbers behind this figure
| Year | Channel videos of 40 to 150 minutes | With a tracklist here | Share | Median view percentile of those sets | Identified songs per set |
|---|---|---|---|---|---|
| 2012 | 290 | 29 | 10% | 82th | 7 |
| 2013 | 464 | 54 | 12% | 72th | 8 |
| 2014 | 615 | 72 | 12% | 69th | 8 |
| 2015 | 629 | 84 | 13% | 80th | 9 |
| 2016 | 705 | 78 | 11% | 76th | 10 |
| 2017 | 609 | 74 | 12% | 78th | 10 |
| 2018 | 367 | 86 | 23% | 76th | 10 |
| 2019 | 870 | 147 | 17% | 76th | 9 |
| 2020 | 249 | 118 | 47% | 44th | 10 |
| 2021 | 301 | 105 | 35% | 67th | 11 |
| 2022 | 387 | 231 | 60% | 52th | 10 |
| 2023 | 439 | 386 | 88% | 50th | 10 |
| 2024 | 327 | 296 | 91% | 52th | 10 |
| 2025 | 266 | 241 | 91% | 48th | 11 |
| 2026 | 110 | 84 | 76% | 51th | 12 |
The sampling check, inside 2022-2025, where coverage is near complete:
| Sets, by views within their year | Sets | Effective number of styles (95% interval) |
|---|---|---|
| top 20% by views | 253 | 20.3 (17.1 to 24.6) |
| middle 60% | 754 | 18.2 (16.3 to 20.3) |
| bottom 20% | 253 | 27.0 (22.8 to 31.0) |
Sources. Tracklists: the published tracklists of the sets, whose songs were identified by audio fingerprinting; 3,522 Boiler Room entries, merged to 3,065 sets, of which 2,245 are matched to a dated video and used here. Styles, genres and release years: the Discogs data dumps (CC0), matched to each song offline; a song gets the styles of its own release, or of another version of the same title; artist-level styles are used only as a check. Channel data: the public metadata of all 10,239 videos on Boiler Room’s YouTube channel (title, upload date, length, views), read in October 2026. No song or label is named, and no comment is used. Performers are named only in section 6, for the most watched sets, from the titles of their videos.
Coverage. Figure 8 shows, for each year, the channel’s videos of 40 to 150 minutes and the share with a tracklist: 10% to 23% in 2012 to 2019, 35% to 60% in 2020 to 2022, 88% to 91% in 2023 to 2025, 76% in 2026 so far.
Measures. Effective number of styles (or cities): the inverse of the probability that a play from one set and a play from another set share a style, which is the number of equally common styles that would give the same probability. A song with several styles gives each an equal fraction. Pairs within the same set are excluded, so the measure does not grow with the number of sets. Styles for 80% of plays and distinct cities, which do grow with the sample, are computed on sixty sets drawn without replacement from each year, a thousand times. Spread within a set: the mean, over pairs of identified songs in the set, of one minus the overlap of their style sets (sets with fewer than five styled songs are left out). Age: the year of the set minus the earliest release year Discogs gives for the song. Landmark sets (section 6): the ten most viewed sets with a tracklist of ten songs or more and a full year of sets either side of their upload, and Folamour’s of 2019. The year after starts 45 days after the upload, the usual gap between filming and publishing; the comparison dates are every 30 days from 6 to 36 months away; the comparison sets for songs are those published within 180 days.
Uncertainty and trends. 95% intervals from a thousand resamples of sets within each year. Period values are means of yearly values. Trends are least-squares slopes of yearly values, with intervals from the same resamples. Years with fewer than forty sets (only 2012) are shown but left out of periods and trends.
Sampling check. Our sets’ median view percentile within their year: 69% to 82% in 2012 to 2019, 44% to 67% in 2020 and 2021, about 50% from 2022. Inside 2022 to 2025, effective number of styles by views: most viewed fifth 20 (17 to 25), middle three fifths 18 (16 to 20), least viewed fifth 27 (23 to 31). YouTube’s own tags were considered as a check on genre and rejected: they are boilerplate lists that change by period, not by set.
What is not claimed. No result here is causal. Changes that coincide with the coverage break of 2019-2020 are flagged as such. “Played before release” is not reported, since recent releases are under-catalogued.
References. Richard A. Peterson and Roger M. Kern, “Changing Highbrow Taste: From Snob to Omnivore”, American Sociological Review 61 (5), 1996. Simon Reynolds, Retromania: Pop Culture’s Addiction to Its Own Past, Faber and Faber, 2011.
Analysis, writing and figures by Jad Benyahia. This piece names no songs or labels and uses no comments; performers are named only for the most watched sets. Boiler Room is named because it is the subject; Boiler Room is a trademark of its owner. ZERONOISE is an independent project and is not affiliated with, or endorsed by, Boiler Room.